Kashef is a Real-Time Application Health Monitoring and Analysis Framework
Different features of Kashef Technology are:What kinds of application can Kashef monitor? From Windows OS health to Web Application Transaction health and anything in between.
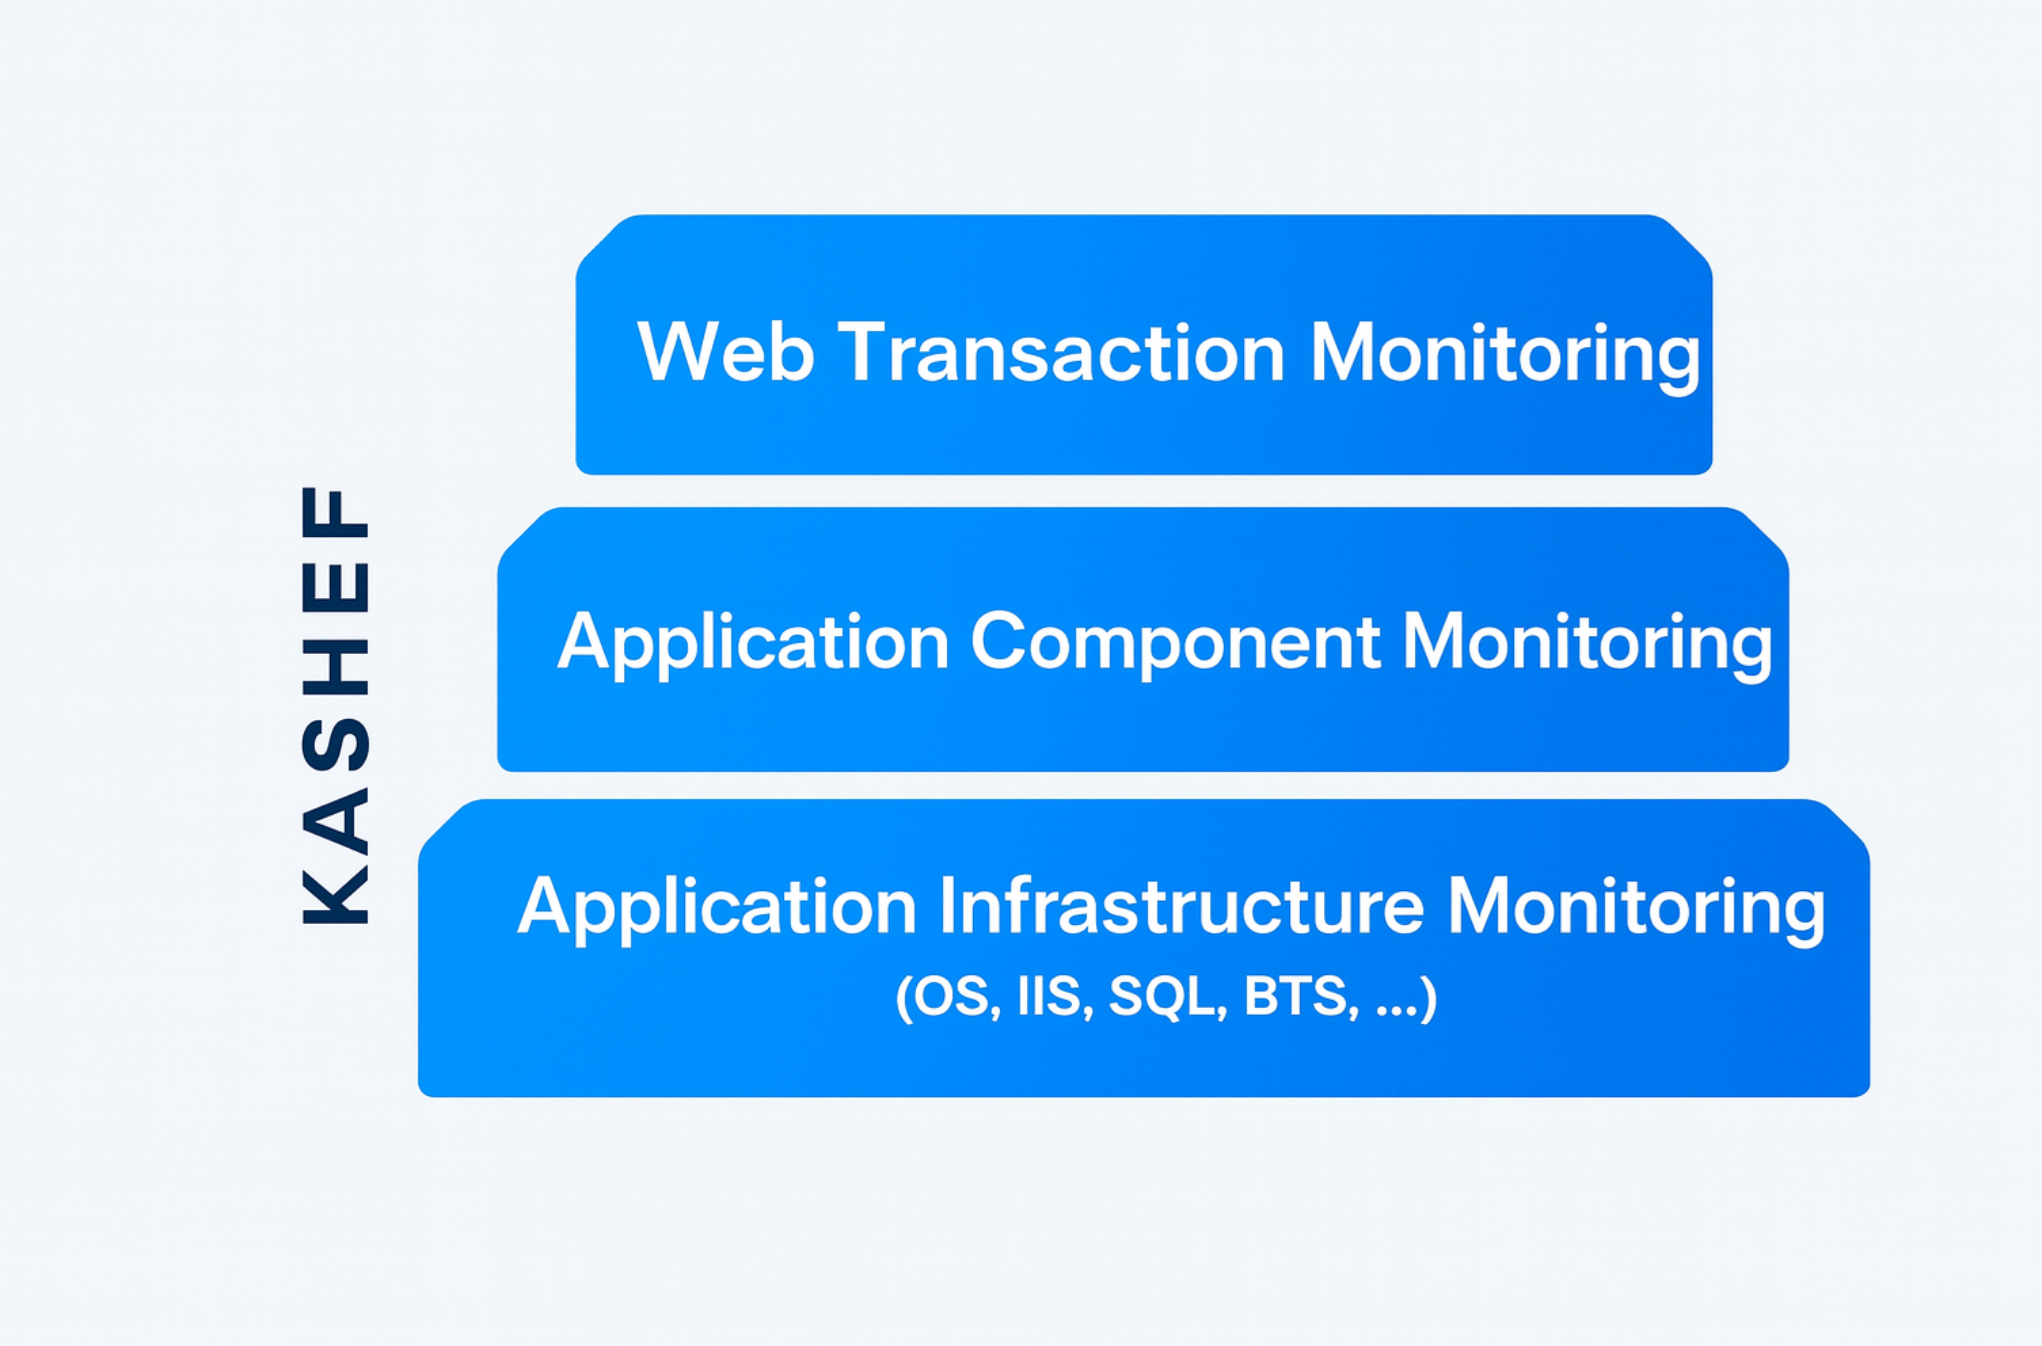
Critical system monitoring starts with monitoring the foundation of any modern system. This includes the Windows OS and other foundational technology such as MSMQ, IIS, ASP.Net, IBM MQ Series and Biztalk.
Application Component Monitoring
Today’s complex internet and intranet applications require the availability of a complex array of application components. All these components must be healthy in order to have a continuous business operation. The majority of such components are SOAP web services which are deployed on a web farm and can easily be monitored by Kashef.
Web Transaction Monitoring
The most advanced form of monitoring is through the execution of actual channel level business transactions. This provides the best measure of general application availability and performance from an end-user perspective. Kashef has the ability, using specialized automation scripts, to login to web applications and perform actual transactions in exactly the same matter as a real user. Such a setup can track application behavior on a 24x7 basis and under non-ideal network latencies from multiple client locations.Archer Innovation Group has multiple simulation servers spread between North America, Middle East and Europe that can be configured to meet any remote monitoring need.
 The majority of current enterprise level monitoring solutions employ a store-then-present approach. This means that the information shown is at least 5 minutes old in the best of circumstances. This threshold can be reduced in some cases but this implies excessive and costly storage requirements. Such a delay is acceptable for monitoring needs that are looking as short term and long term trends but falls short when it comes to critical availability monitoring and troubleshooting. Production support engineers know very well that during a critical emergency, it is absolutely necessary to know the exact current situation across the datacenter. Knowing where the issue is can quickly pinpoint the root cause of the problem and provide instant feedback on any correction procedures that are applied.
Kashef on the other hand employs a streaming design that does not depend on any physical storage of the data. Coupled with scalable deployment architecture, this implies that information provided is delayed by seconds only from its source
An end-user application is usually built to meet certain business objectives. A healthy application is one that can provide this business functionality within a certain upper timeframe. Excessive slow applications are considered unhealthy. At the infrastructure level, health is a function of more technical measures such as CPU utilization, remaining server memory, available disk space, etc. Such concepts are at the heart of Kashef design.
 Visualization, notification and actuation are key components of any enterprise monitoring solution. Mature organizations and support centers typically contain a large NOC (Network Operation Center) which is filled with graphical monitoring dashboards that represent current system health. Smaller organizations will have several dedicated workstations in the operations room to meet such needs. In addition to graphical dashboards, notifications are used to push information to remote users over email or sms when certain conditions are met. Actuation is the process of performing automated corrective actions based on certain conditions. This is the most advanced stage in mature organizations where most critical infrastructure events can be self corrected to create the highest availability.
Kashef allows users to customize dashboards to meet their particular needs. Dashboards include gauges, tables, and charts. In addition, Kashef can integrate with email and SMS gateways for active notification. Actuation is also possible through specialized scripting components.

Advanced analysis of collected health signals is what truly differentiates one monitoring system from another. True system health and prognosis determination can only be determined by examining a variety of sources over a period of time. In many ways, this is equivalent to monitoring a patient in a hospital’s Intensive Care Unit where a variety of current measures such pulse rate, respiration rate, blood pressure and body temperature in addition to historical charts are used by Doctors. For an example from the IT world, take CPU utilization as an example. A server’s processing health cannot be determined from a single reading because short-term CPU spikes are normal. Rather, a standard notification rule would state that if % CPU utilization of a given server averages 95% for one minute or longer, then an alarm should be raised. In a server farm scenario, things become more complex. For example, it may only be required to raise a flag if the CPU utilization of 75% of the servers exceeds 95% for longer than a minute.
This advanced form of health analysis which spans space and time has been limited due to the complexity and cost of the technology involved. This is the domain of an area of technology called Complex Event Processing (CEP). Traditionally limited to financial industry data analysis, CEP technology has not reached the mainstream.
Kashef now brings this technology to a wider audience and makes it affordable to small and medium companies. End users can take advantage of this through the use of the ready-made analysis modules that employ this power or by building custom analysis packs.
Click here for more details

Most companies have unique and continuously changing monitoring needs. These needs change with natural growth which leads to an increase in the datacenter size and application diversity. Monitoring applications need to be agile to keep up with this growth and increased complexity.
Kashef meets this need through four key features:
-
Customizable and generic data collection engine:
Kashef consultants or internal IT staff are empowered to create customized collection modules which can tap into health data of the majority of industry systems only through configuration. -
Customizable analysis framework:
for more details.
Trained IT users can enhance existing analysis packs or create brand new ones. Kashef includes an Integrated Design Editor that allows the configuration of rules using an electronic-circuit like methodology. In addition, a fully capable scripting engine is included which means that the most complex of analysis algorithms and decision trees can be implemented. -
Customizable monitoring dashboard:
for more details.
The same editor used to create or customize analysis packs can be used to create or revise dashboards. Gauges and charts can be created and linked to provide an intuitive and simple dashboard interface.
-
Scaleable deployment architecture:
for more details.
Kashef packs, whether collection, analysis or visualization packs, can be deployed on a single or multiple servers. In fact, standard implementations necessitate at least one server within the datacenter to act as a collection and analysis point and one or more visualization stations. Complex implementations at large sites typically employ segregated servers for each tier. Communication between Kashef servers uses standard communication protocols that can travel through firewall's as needed.